
Project Description:
Supported by the California Department of Water Resources, the study addresses issues of sediment transport and trap efficiency of the Cache Creek Settling Basin (CCSB)
The CCSB is a 14.5 square-kilometer sediment retention basin subject to inflows with high sediment concentration. The sole purpose of the CCSB is to retain sediment and protect the floodway capacity in the Yolo Bypass. Current performance of the CCSB is in question following over 70 years of high sediment loading. Operation plans dictate that alterations be made to the levees and/or overflow weir in the basin when trap efficiencies are less than 30 percent. CCHE2D model, a 2D depth-averaged hydrodynamics and sediment transport model, is applied to simulate the sediment transport process in the CCSB. Simulations are performed to evaluate the trap efficiency in the basin under current bathymetric conditions. Possible alternatives, such as raising the overflow weir, and removing portions of the levee, are also evaluated. Recent and historical flows and sediment loads are simulated.
The simulations encompass 13.5 kilometers of the compound channel of Cache Creek, from the USGS Cache Creek at Yolo gauge (11452500) to the entrance of the settling basin (USGS gauge 11452600 near Road 102) and the leveed CCSB. Roughness conditions, geometric characteristics and scale vary significantly in the natural channel of Cache Creek and the CCSB, as well as within the basin itself, creating a study area that is a challenge to simulate numerically. Initial conditions, boundary conditions, and calibration and validation data are taken from the USGS sites listed in the map below.
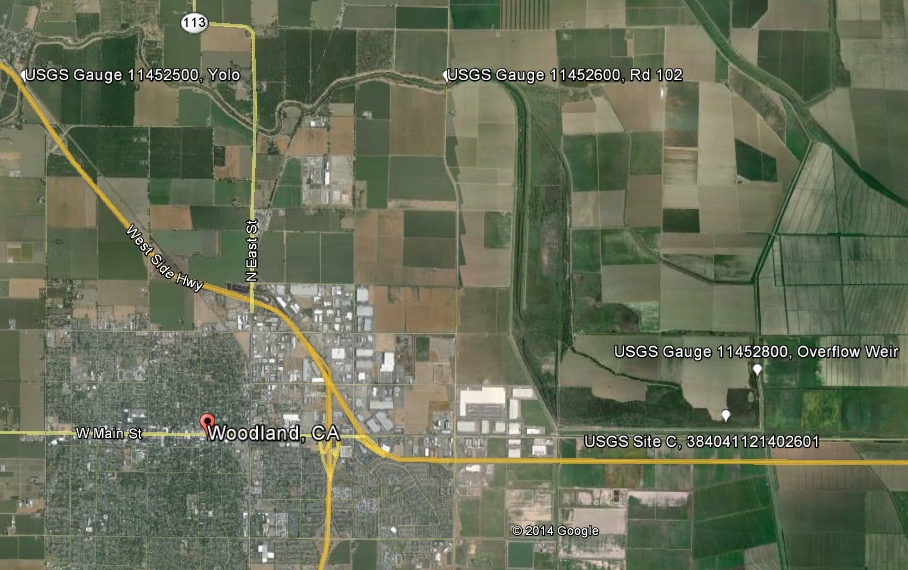
Map of Cache Creek extent with USGS gauge station locations.
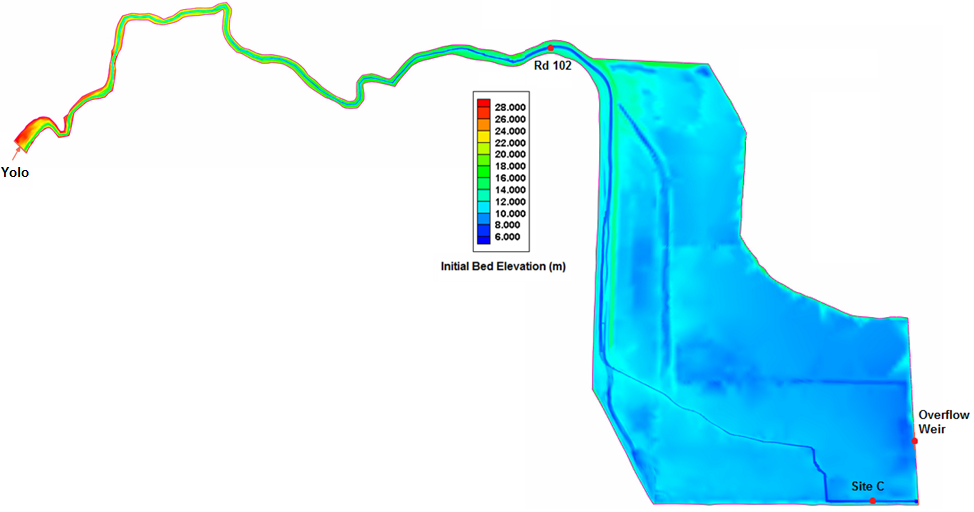
Elevation contour of computational domain.

Simulation Mesh
Flow Simulations
The inflow boundary condition was observed at the Cache Creek at Yolo gauge (11452500, USGS, 2011) as 15-minute discharge data. Downstream boundary conditions for the overflow weir (USGS gauge 11452800) and low flow culvert (USGS gauge 11452900) were set as rating curves.
Calibration simulation results of water surface elevation are shown below.
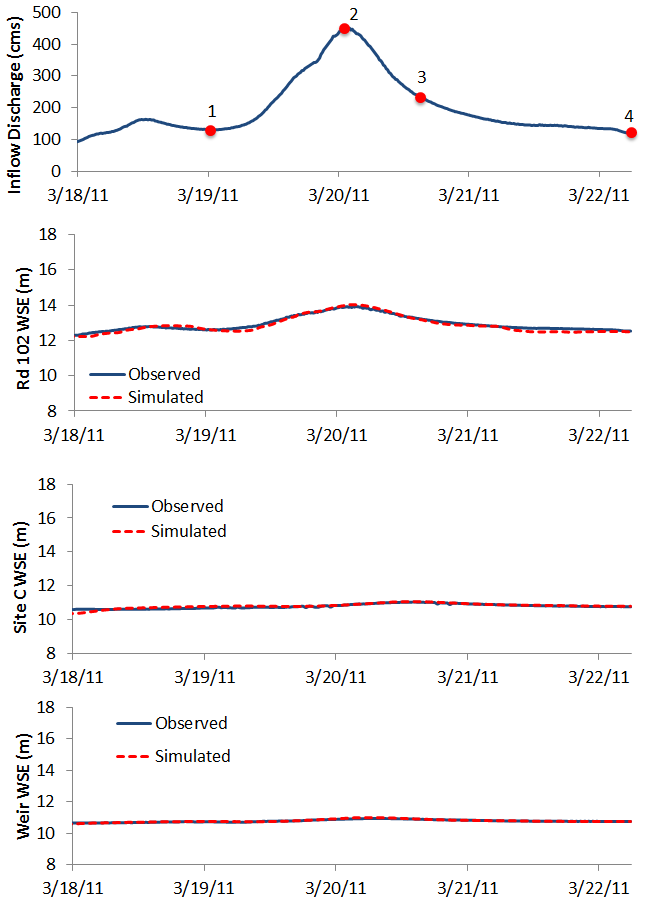
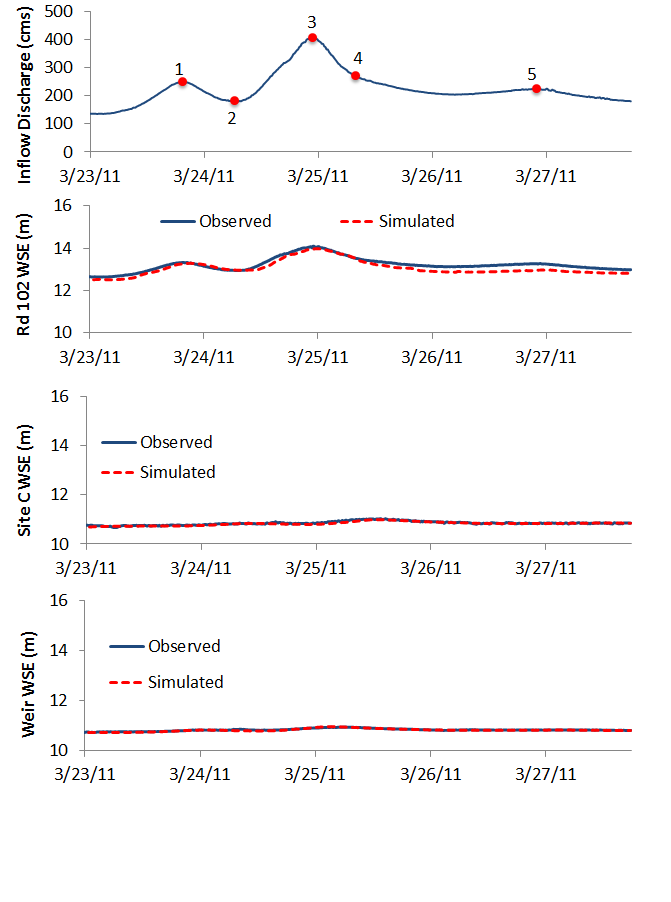
Calibration inflow boundary condition, and measured and simulated water surface elevation for Rd 102, Site C, and the Overflow Weir.
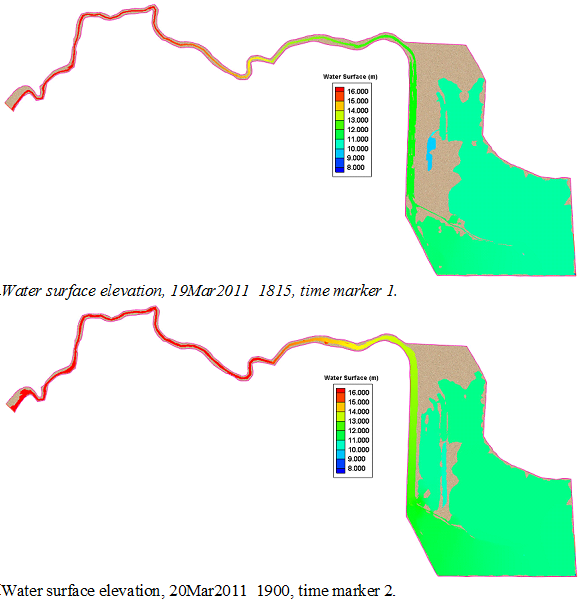
Simulated water surface elevation at time markers 1, and 2, as identified in inflow boundary condition.
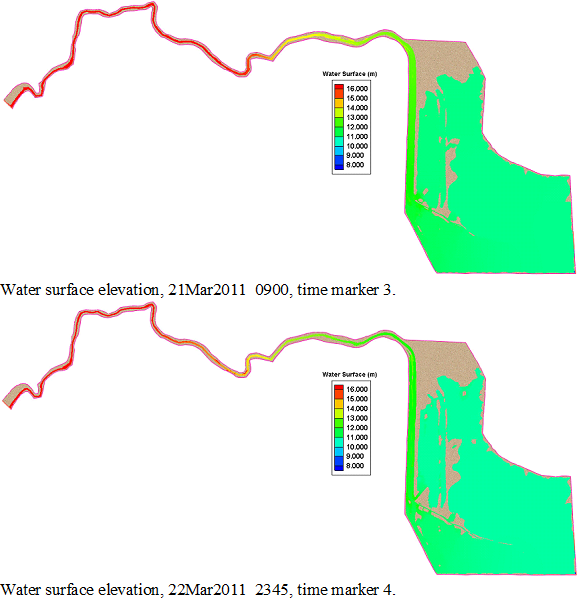
Simulated water surface elevation at time markers 3, and 4, as identified in inflow boundary condition.
Validation simulation results of water surface elevation are shown below.
Validation inflow boundary condition, and measured and simulated water surface elevation for Rd 102, Site C, and the Overflow Weir.
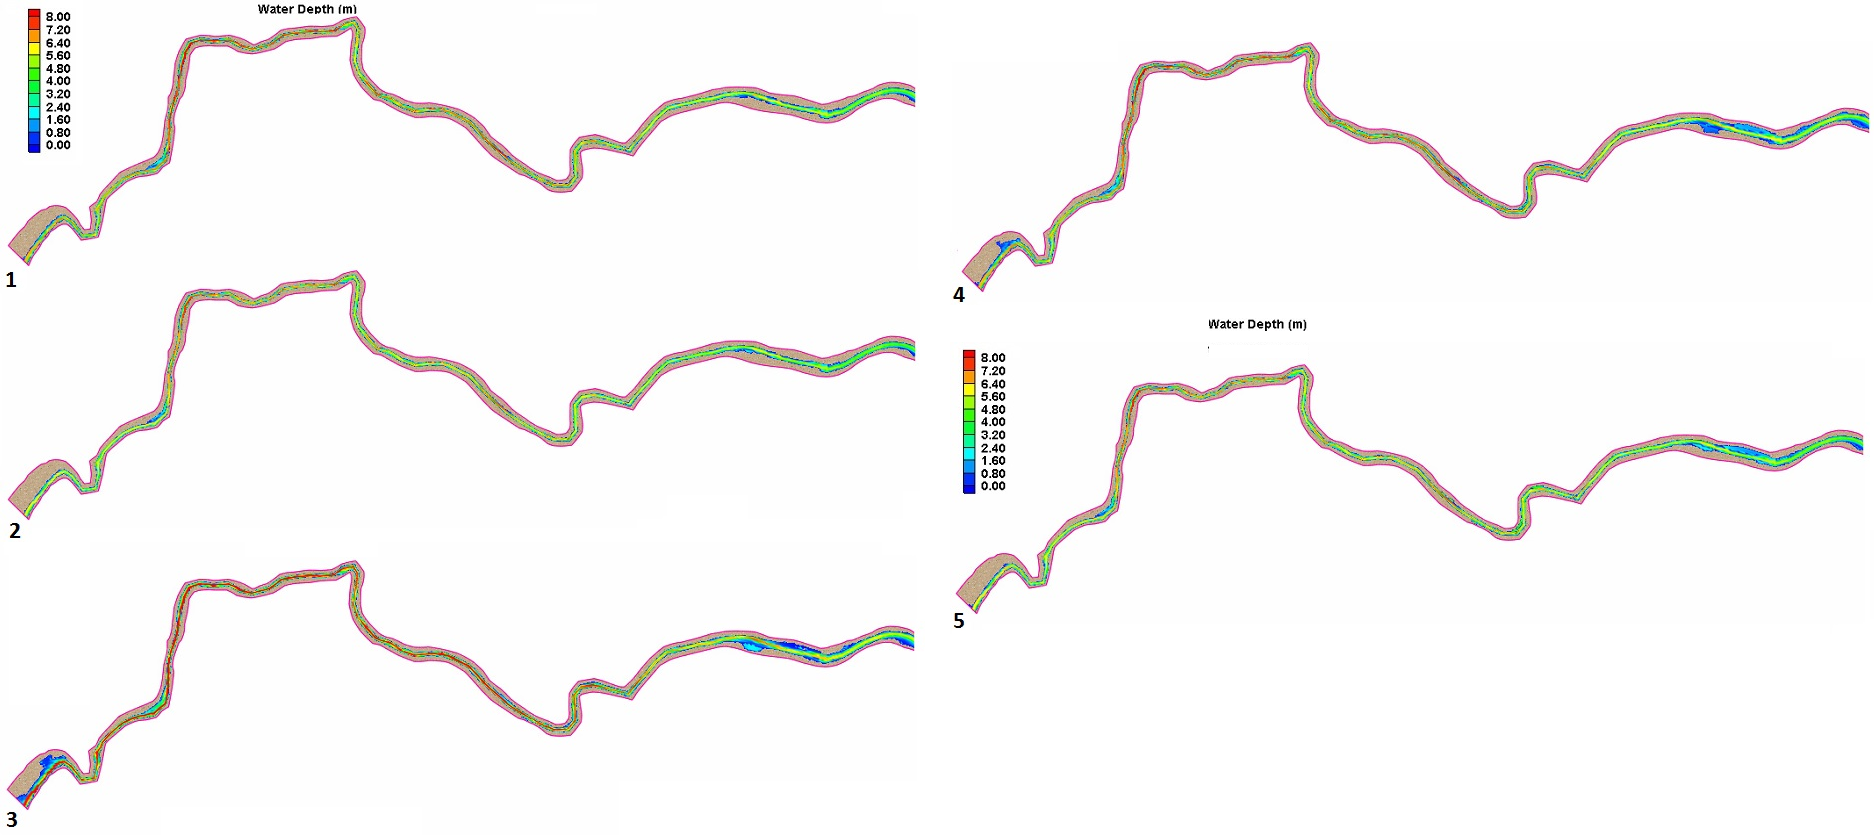
Simulated water surface elevation in Cache Creek extent, at time markers 1 through 5, as identified in inflow boundary condition.
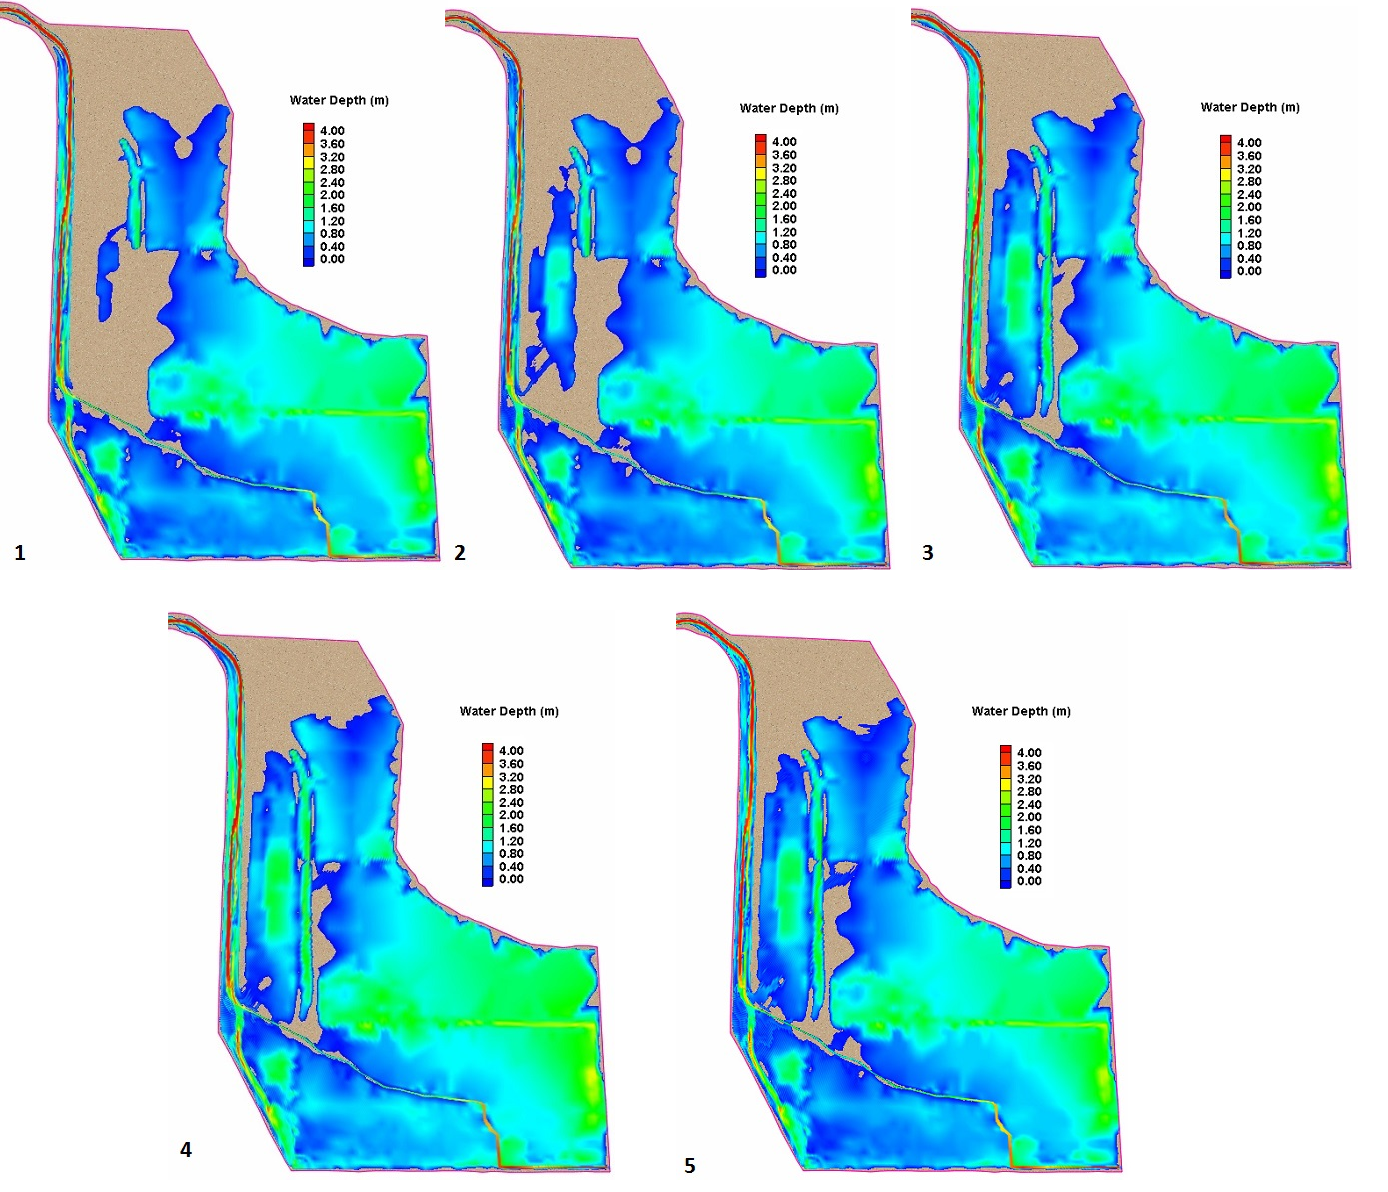
Simulated water surface elevation in CCSB, at time markers 1 through 5, as identified in inflow boundary condition.
Sediment Simulations
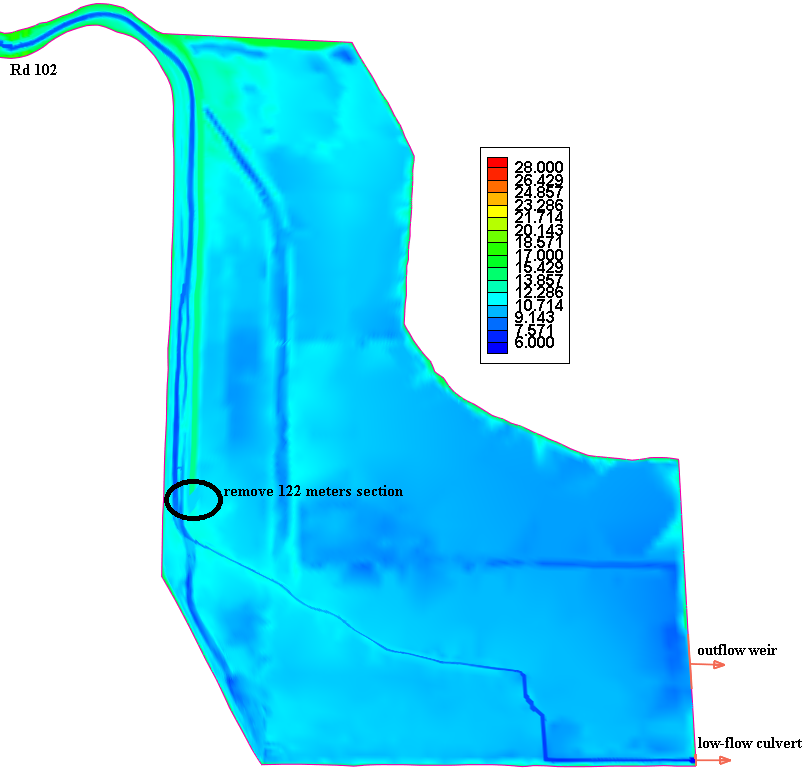
Sediment transport simulations based on three different management alternatives are presented, current condition, raising the outflow weir 1.8 meters, and removing 122 meters of the training channel, denoted as Alternative A, Alternative B and Alternative C, respectively. Inflow conditions are as shown for flow calibration simulations above.
Alternative A – Current Bathymetry
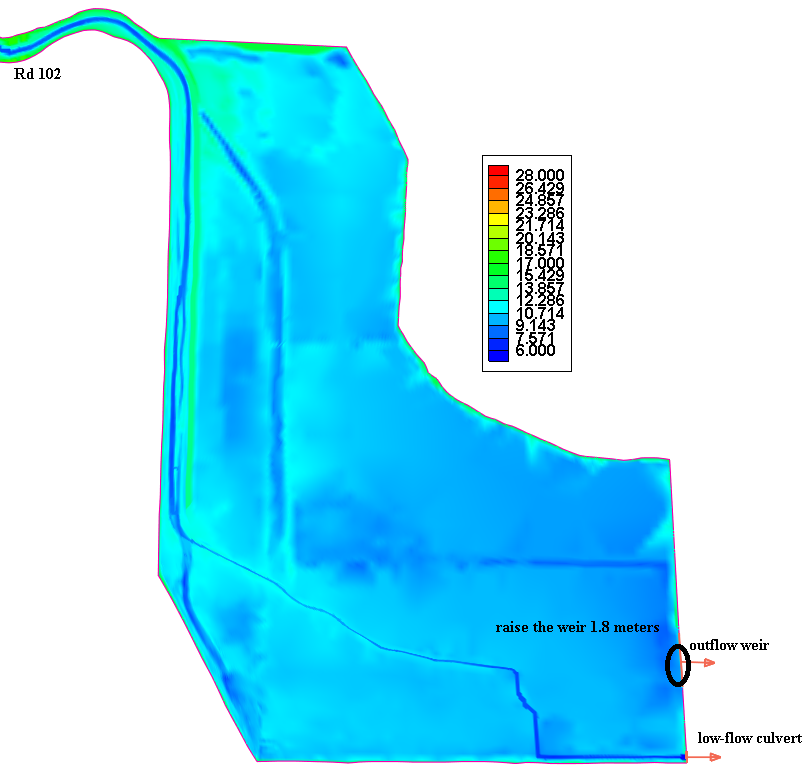
Alternative B – Weir Raised 1.8 Meters
Alternative C – Training Channel Section Removed

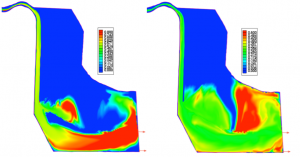
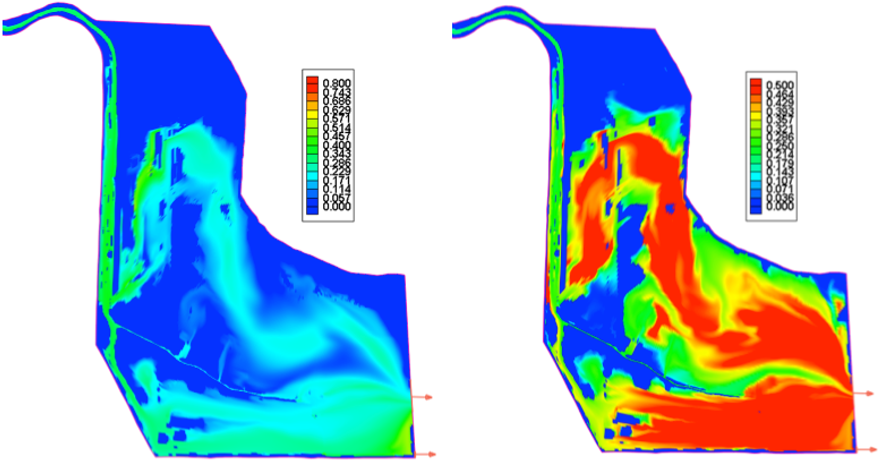
Current Configuration – Final bed load transport rate (kg/m/s, left figure) and suspended load concentration (kg/m3, right figure)
Alternative B – Final bed load transport rate (kg/m/s, left figure) and suspended load concentration (kg/m3, right figure)
Alternative C – Final bed load transport rate (kg/m/s, left figure) and suspended load concentration (kg/m3, right figure)